This month, our updates include two functionality improvements to the Analyze tab: the addition of trip ends and a new interface for picking dates. Read on to learn more about why these matter.
Trip ends in Analyze
The Analyze tab has always been cities’ key resource for understanding specific metrics, such as trips by hour. In the past, users were only able to view these metrics by “available vehicles” or “trip starts.” Now, they can also filter these metrics by trip ends.
The ability to filter by trip ends means cities can now understand when trips ending at transit centers occur most frequently. That way, you can plan accordingly for peak commute hours. It also is helpful when evaluating whether curfews on specific parking zones are being followed. You are able to make sure that trips are not ending in those zones during the given hours.
Dates interface in Analyze

New interface for date picking in Analyze
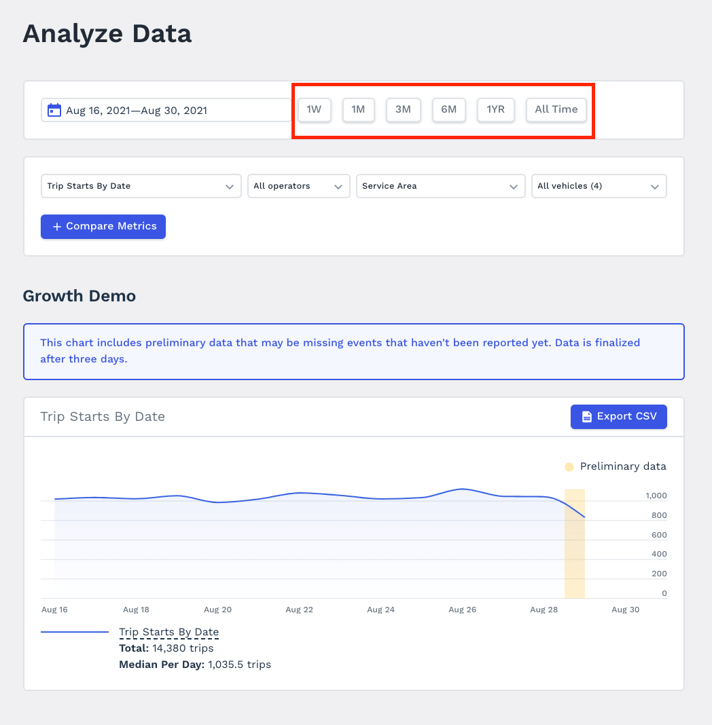
Another improvement we’ve added to Analyze is the interface for picking dates. We noticed that most cities are analyzing data for certain time periods — 1 week, 1 month, 3 months, 6 months, and 1 year. Another common time period being requested was for the full program duration.
Manually inputting these dates was time-consuming and not user-friendly, so we updated the interface to show buttons for these commonly requested timeframes. Now, users like you are able to select their desired date range in a matter of seconds.
Lastly, we are currently testing our Policy API and encourage cities to reach out if you are interested in learning more.
